After accumulating a number of servers/networking gear, it got too much for me to navigate to each of their respective dashboards to view their metrics. Then, an idea spawned: I’ll set up a monitoring stack, and aggregate all the metrics I want into a single dashboard.
This is the end result, and setting up the backend infrastructure to make this posssible is what I’ll be walking through in this post:
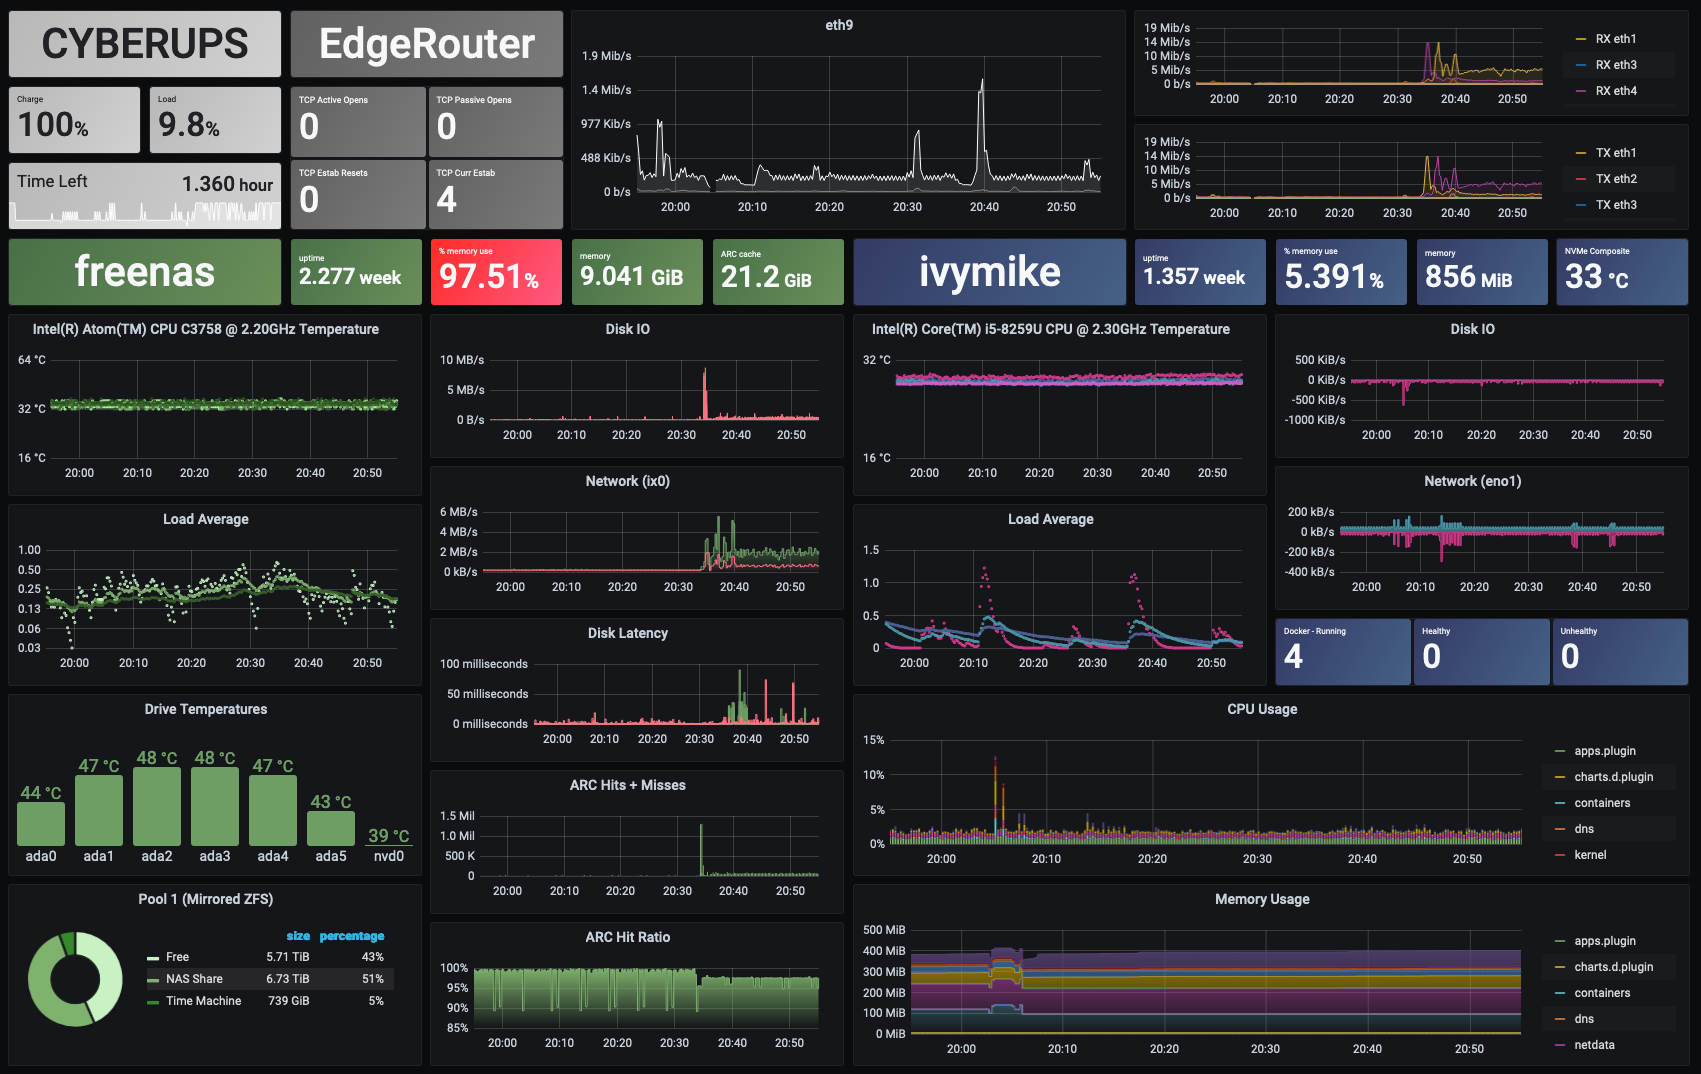
Table of Contents
- Intro
- Architecture
- Prometheus
- Netdata (ivymike)
- graphite-exporter (FreeNAS)
- snmp-exporter (EdgeRouter)
- Grafana
Intro
Before diving into the nitty-gritty, there are four overarching questions that need to be answered:
- Where/what metrics endpoints will be monitored?
- What will ingest the metrics? Can it support all the endpoints?
- What will be used to visualize the metrics?
- Where/how will the monitoring service(s) run?
To answer these questions:
1. Where/what metrics endpoints will be monitored?
This depends on what systems/servers you have. In my case, these are the systems I want to monitor, and what technologies they use to expose metrics:
- Arch Linux Server (ivymike) - Netdata installed on the host
- FreeNAS Server (freenas) - natively exposes Graphite metrics
- Ubiquiti EdgeRouter - natively exposes metrics over SNMP
- CyberUPS uninterruptible power supply - connected to Arch Linux server, is included in Netdata metrics
2. What will ingest the metrics? Can it support all the endpoints?
Here, there are 2 major industry-accepted technologies: InfluxDB and Prometheus. Both are more than adequate to monitor all endpoints, so it comes down to personal choice.
After doing some research, this StackOverflow post and the following one swayed my decision towards Prometheus. It seems like InfluxDB has trouble scaling with a massive amount of servers, so Prometheus would be more useful industry experience.
3. What will be used to visualize the metrics?
This field is largely dominated by one tool - Grafana - there doesn’t seem to be any other serious competition. This is also easy to integrate with either data ingest tools, so it’s an easy choice.
4. Where/how will the monitoring service(s) run?
The final question has 2 answers - the entire monitoring stack will be running in Docker containers, and orchestrated using docker-compose. These containers will run on the Arch Linux server, an Intel NUC called ivymike.
Architecture
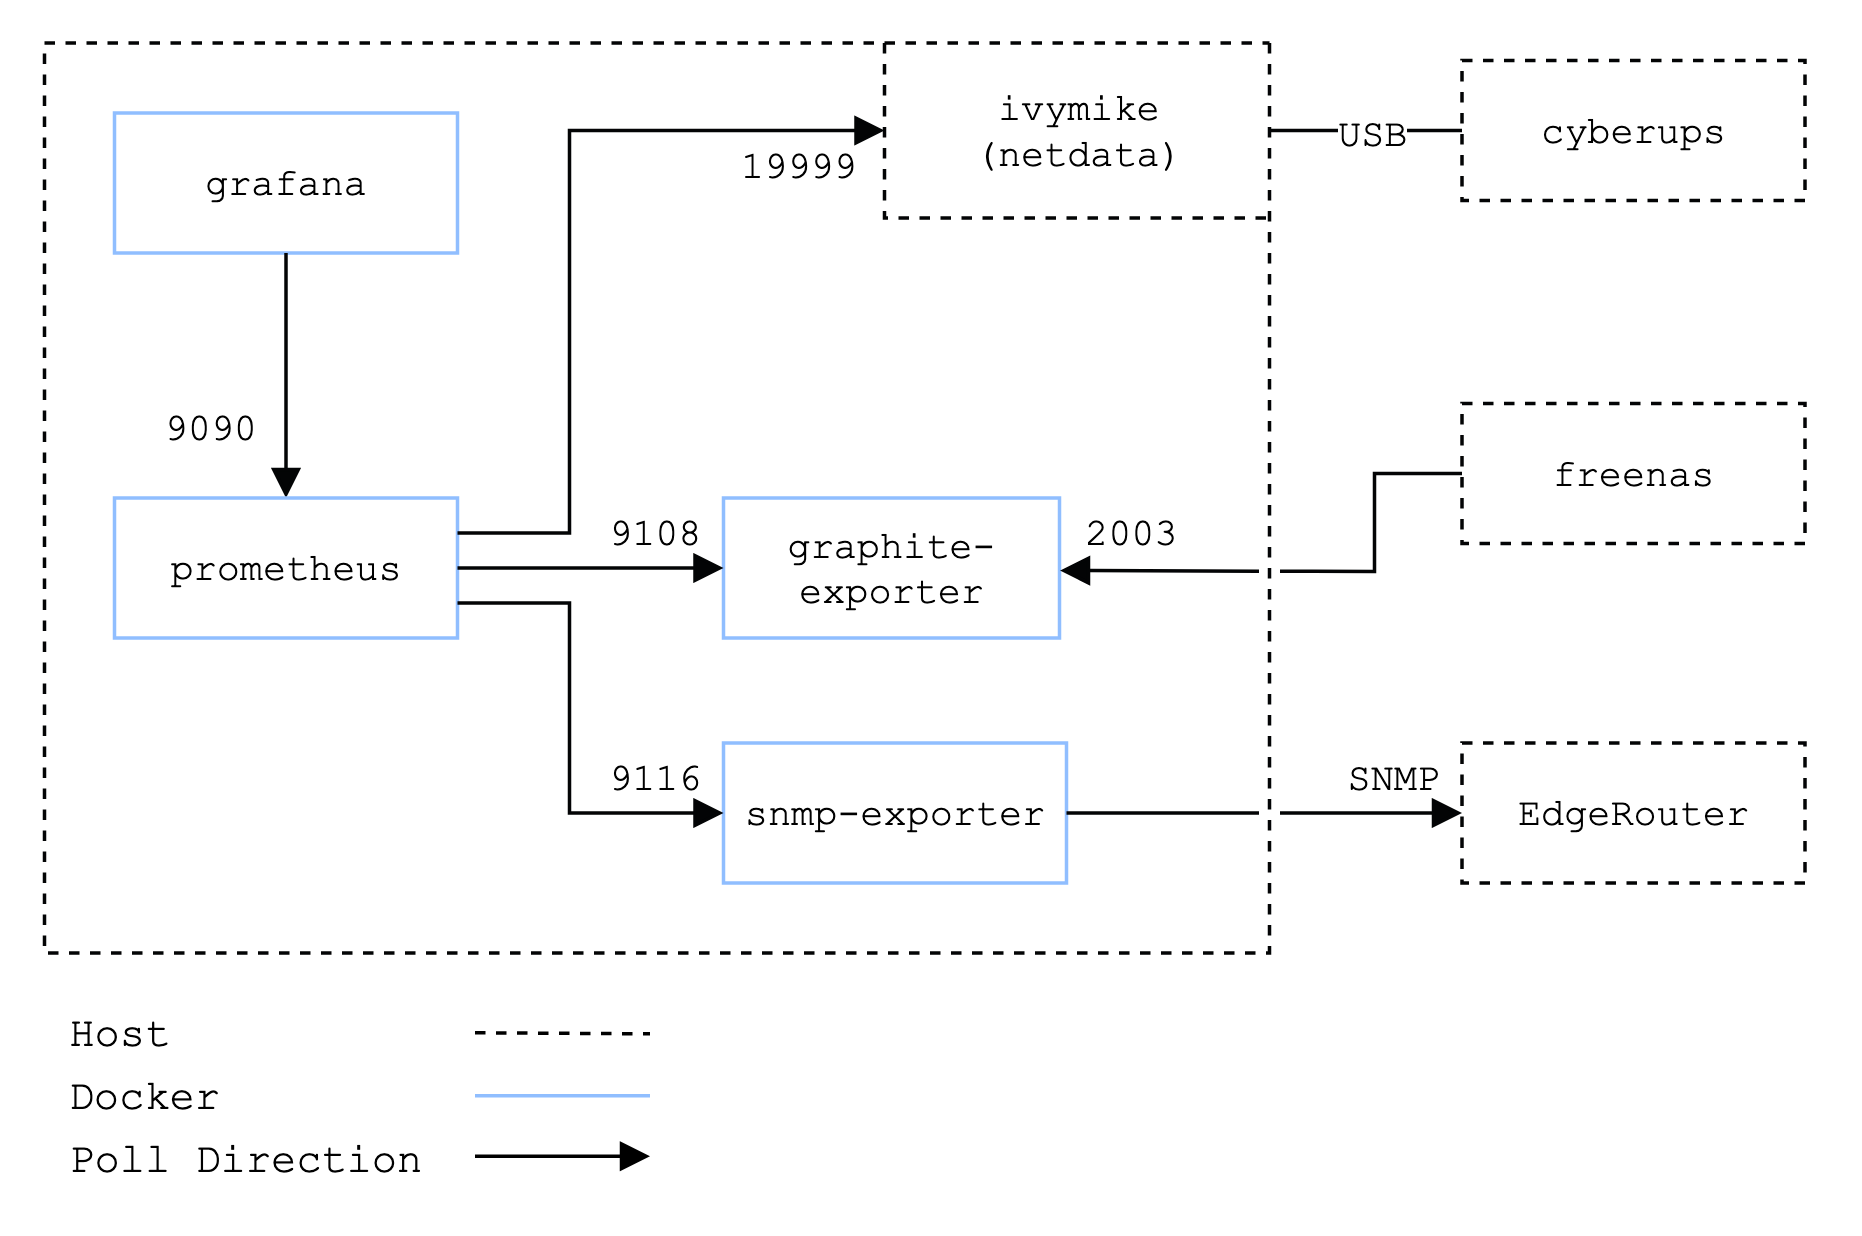
The architecture is fairly straightforward. Prometheus is the center of the metrics collection, polling Netdata directly and both FreeNAS & the EdgeRouter over 2 *-exporter containers. The graphite-exporter container converts FreeNAS’s Graphite push metrics into one that Prometheus can poll, and snmp-exporter uses the native SNMP functionality of EdgeRouter to expose metrics to Prometheus. Finally, Grafana provides a way to visualize the aggregate data.
Each of these subsystems are covered in more detail below, with each section showing the configuration files required to set them up:
Prometheus
The focal point of this setup, Prometheus runs in a docker container orchestrated by docker-compose. The following snippet is what sets up the container.
The command: directive overwrites any CLI args that may be included by default in the container, so when I wanted to use it to specify the metrics retention time, I had to also include everything that was used to start the Prometheus instance.
docker-compose.yml
version: "3"
services:
  prometheus:
    build: prometheus/
    restart: unless-stopped
    command:
      # Default CLI options to start Prometheus, taken from the container. docker-compose's
      # `command:` directive overwrites any CLI args, so if we want to use the directive,
      # all the args need to be redefined.
      - --config.file=/etc/prometheus/prometheus.yml
      - --storage.tsdb.path=/prometheus
      - --web.console.libraries=/usr/share/prometheus/console_libraries
      - --web.console.templates=/usr/share/prometheus/consoles

      # Max metrics retention time set to one year
      - --storage.tsdb.retention.time=1y
    ports:
      - 9090:9090
    volumes:
      - "/mnt/nas-share/Prometheus:/prometheus:rw" # Metrics are stored on NAS
      - "/etc/localtime:/etc/localtime:ro" # Keep container time synced with host
# ...
Prometheus is configured using a YAML file, prometheus.yml. This Dockerfile is simply set up to copy it into the container:
Dockerfile
FROM prom/prometheus:v2.22.0
ADD prometheus.yml /etc/prometheus/prometheus.yml
You’ll be seeing much more of this configuration file in the following parts. This is how Prometheus knows how to poll all the different metrics systems, so each one will get their own entry. In this snippet, the global scrape interval is set, and Prometheus is configured to monitor itself.
prometheus.yml
global:
  scrape_interval: 15s
  evaluation_interval: 15s

# A scrape configuration containing exactly one endpoint to scrape:
# Here it's Prometheus itself.
scrape_configs:
  - job_name: "prometheus"
    # metrics_path defaults to '/metrics'
    static_configs:
      - targets: ["0.0.0.0:9090"]
# ...
Netdata (ivymike)
Since Netdata is already installed on the host, all that’s needed is to add a job for it in Prometheus’s configuration. The source is set to average, which returns the same metrics that are displayed on the native Netdata dashboard.
prometheus.yml
# ...
  # Netdata to Prometheus metrics for both ivymike and cyberups
  - job_name: "netdata"
    metrics_path: "/api/v1/allmetrics"
    params:
      format: [prometheus]
      source: [average]
    honor_labels: true
    static_configs:
      - targets: ["192.168.2.39:19999"]
# ...
graphite-exporter (FreeNAS)
This container is the simplest to set up, since no configuration needs to be done aside from defining it in docker-compose. FreeNAS assumes that the Graphite endpoint is at port 2003, but this container listens on port 9109 for metrics, so the port translation needs to be set to 2003:9109.
docker-compose.yml
# ...
  graphite-exporter:
    image: prom/graphite-exporter:v0.9.0
    restart: unless-stopped
    ports:
      - 9108:9108 # expose exported metrics for Prometheus
      - 2003:9109 # ingest Graphite metrics from FreeNAS
    volumes:
      - "/etc/localtime:/etc/localtime:ro" # Keep container time synced with host
# ...
The Prometheus configuration is very simple:
prometheus.yml
# ...
  # Graphite to Prometheus exporter for FreeNAS data
  - job_name: "freenas"
    honor_labels: true
    static_configs:
      - targets: ["192.168.2.39:9108"]
# ...
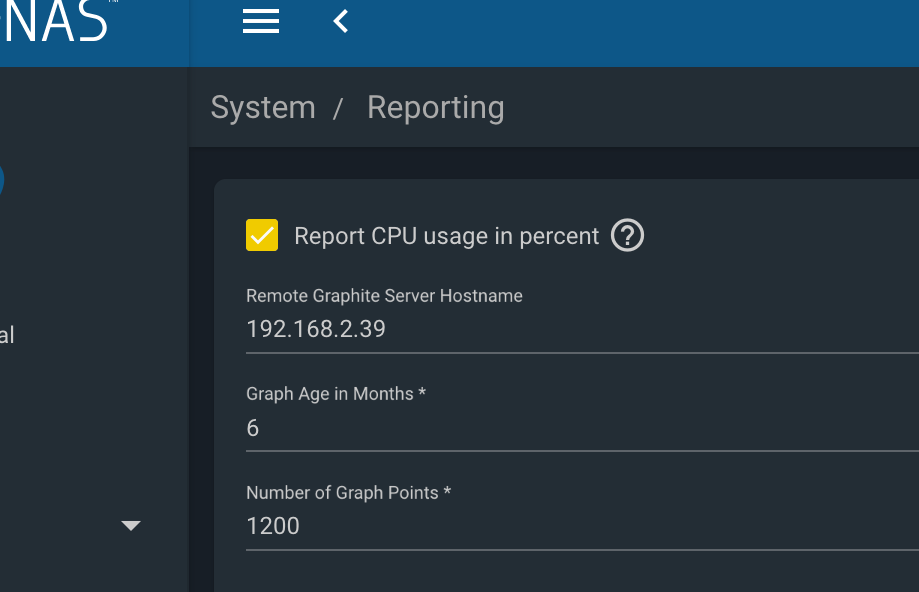
On the FreeNAS dashboard, the IP of the Graphite endpoint has to be set:
snmp-exporter (EdgeRouter)
Getting SNMP metrics can be the most complicated part of this setup. I relied heavily on this blog post and the prometheus-edgerouter github to scrape metrics from the EdgeRouter.
The snmp-exporter container requires a snmp.yml configuration file that maps SNMP OIDs to actual metric names that can be used. This mapping is automatically created using a snmp-generator container and specifying the metrics one wants to get the OID mappings for - and to get this, you would have to manually examine the /usr/share/snmp/mibs/ on the EdgeRouter.
All of this is really tedious, but luckily for us, the prometheus-edgerouter already comes packaged with an snmp.yml file that contains most of the useful metrics - so I simply copy it into my container:
docker-compose.yml
# ...
  snmp-exporter:
    build: snmp-exporter/
    restart: unless-stopped
    command:
      - --config.file=/snmp.yml
    ports:
      - 9116:9116
    volumes:
      - "/etc/localtime:/etc/localtime:ro" # Keep container time synced with host
# ...
Dockerfile
FROM prom/snmp-exporter:v0.19.0
ADD snmp.yml /snmp.yml
I relied on the snmp-exporter github for the Prometheus configuration:
prometheus.yml
# ...
  # SNMP to Prometheus exporter for EdgeRouter metrics
  # Copied & modified these configs from https://github.com/prometheus/snmp_exporter
  - job_name: "edgerouter"
    static_configs:
      - targets:
          - 192.168.1.1 # EdgeRouter device
    metrics_path: /snmp
    params:
      module:
        - edgerouter
    relabel_configs:
      - source_labels: [__address__]
        target_label: __param_target
      - source_labels: [__param_target]
        target_label: instance
      - target_label: __address__
        replacement: snmp-exporter:9116 # The SNMP exporter's real hostname:port.
# ...
The final step is to set a Community String in EdgeRouter, and also add it in snmp.yml.
Grafana
The last part of this metrics setup is the visualization tool, Grafana. Note that the grafana-lib volume is where dashboards/configs are stored, so any changes will be preserved in this docker volume.
# ...
  grafana:
    build: grafana/
    restart: unless-stopped
    ports:
      - 3000:3000
    volumes:
      - grafana-lib:/var/lib/grafana
      - "/etc/localtime:/etc/localtime:ro"
# ...
volumes:
  grafana-lib: {}
I also load the grafana.ini configuration file in case I want to tweak any settings:
Dockerfile
FROM grafana/grafana:7.3.2
ADD grafana.ini /etc/grafana/grafana.ini
To point Grafana to Prometheus, click Configuration -> Datasources from the left sidebar, click Add Datasource -> Prometheus, and set the IP & port to point to Prometheus.
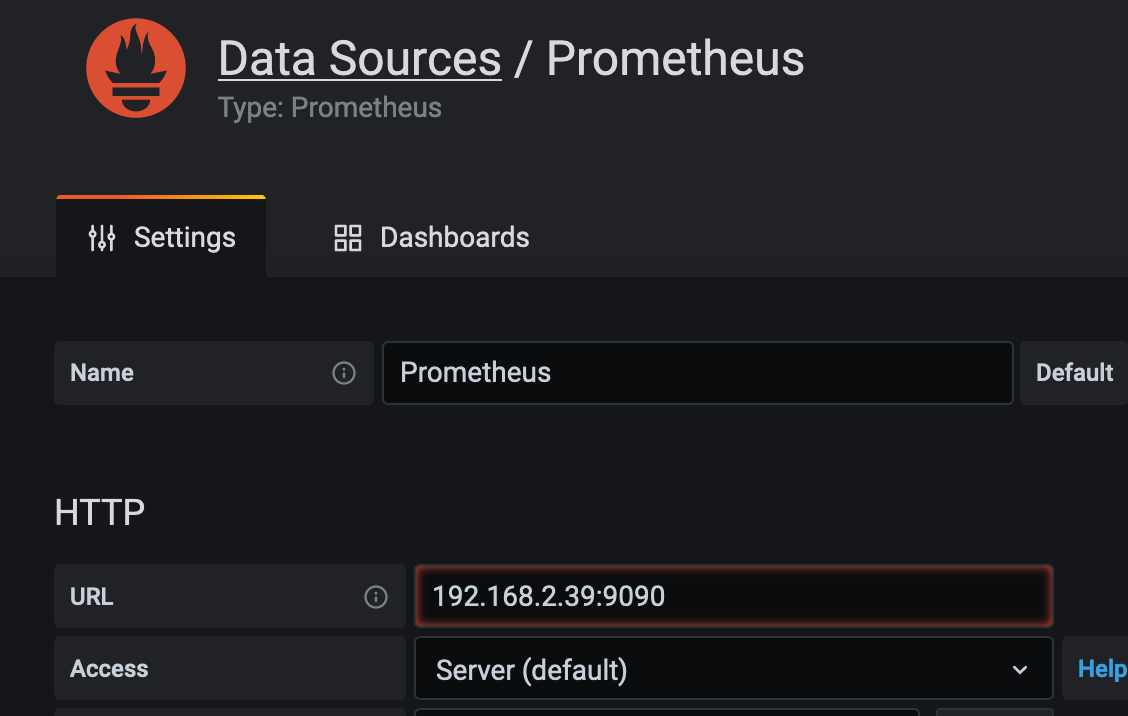
And that’s it for the backend setup!
The final part of this project would be scouring through each of the metrics in Grafana, adding them to different graphical panes, and tweaking theming and colors. That isn’t terribly useful in an entry like this, but fear not - I’ve got the entire project in a Github repo: metrics-npg.
The dashboard, if you would like to load it, is in the dashboard-backups/ directory and called Master Dashboard.json.
Note that one of the graph types is a pie chart, and not included natively with Grafana. I had to run grafana-cli plugins install grafana-piechart-panel from inside the container to use it.